Visual Guide & Diagrams

The geometry matters as much as the chemistry. These diagrams compress the key physical layouts of the knowledgebase into reference images.

1 · Windrow section

56–65° 3–5 m width height 1.5–3 m HOT CORE 55–70 °C MARGINS / SHELL cooler — re-mix into core at turn PAD 2–4% slope → air drawn in at base, convective flow upward
Windrow cross-section: trapezoid profile, hot core, cooler shell, and pad drainage. Peak above ~3 m kills convection — longer, not taller.
TL;DR: trapezoid 3–5 m wide, 1.5–3 m tall, core 55–70 °C, shell re-mixed at each turn, pad slopes 2–4%.

2 · Aerated static pile (ASP) layout

all-weather pad perforated laterals (1–2 m apart) coarse chip plenum 10–15 cm biofilter cover (compost/chips) temp probe BL fan temp-feedback control on-Blower → off when cool air moves through plenum & mix; exhaust exits top (or pulled through biofilter in negative-air)
ASP: perforated laterals under a chip plenum, the mix with a biofilter cover, and temperature-feedback blower control. No turning — the recipe must be right at build.
TL;DR: pipes 1–2 m apart → chip plenum → mix → 10–15 cm biofilter cover → blower on temp feedback. Sanitation: 55 °C × 3 days all through.

3 · Turning pattern

OLD PILE shell (cool) core (hot) turn (loader / turner) NEW PILE everything re-enters the hot core cool shell → hot core →
Turning moves material outside-in and bottom-to-top so every particle spends time in the hot core. Turn at temperature peak, not on a fixed calendar.
TL;DR: every turning re-mixes shell into core; frequency follows the temperature curve.

4 · Recipe blending (the 3 targets)

The recipe is three dials C:N ratio 25–40 : 1 ideal <20:1 ammonia loss · >50:1 too slow Moisture % 50–60% ideal <40% microbes stall · >65% oxygen collapses Free air space ≥ 30% ideal
Recipe design is hitting three targets simultaneously: C:N 25–40:1, moisture 50–60%, free air space ≥30%. Bulking agents are the free-air-space dial.
TL;DR: one recipe, three dials — use the C:N calculator for the chemistry and coarse chips for the air.

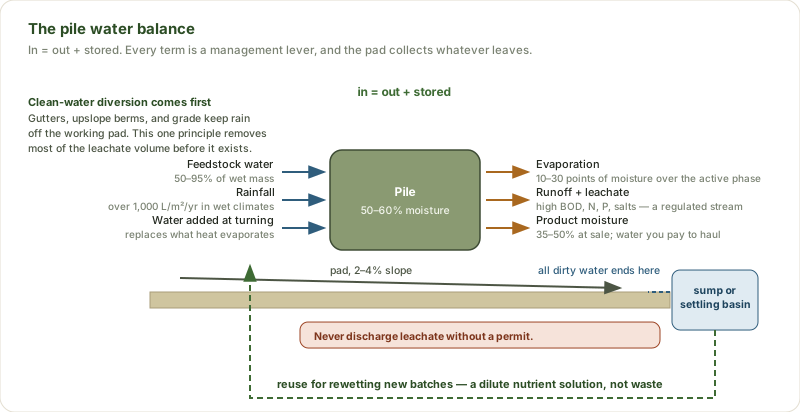
5 · The water story (pad + pile)

Clean water diverted away covered curing PILE pad 2–4% slope sump / basin reuse for rewetting (agronomic) ⚠ no discharge to ditch/tile without permit
Water architecture: clean water diverted, dirty water contained, leachate reused as a dilute nutrient solution. Never let clean water cross the pile. (Deep dive: Water & Leachate.)

6 · Charts & figures across the almanac

The reference diagrams above are the physical geometry; these are the data pictures, process flows and decision charts that sit inside the chapters. Each caption links back to the section it explains.
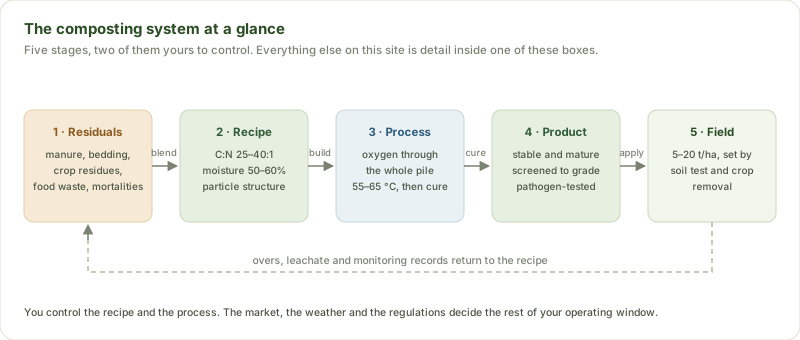
System map of farm composting: residuals, recipe, process, product and field, with overs, leachate and records looping back to the recipe.
The system at a glanceHome
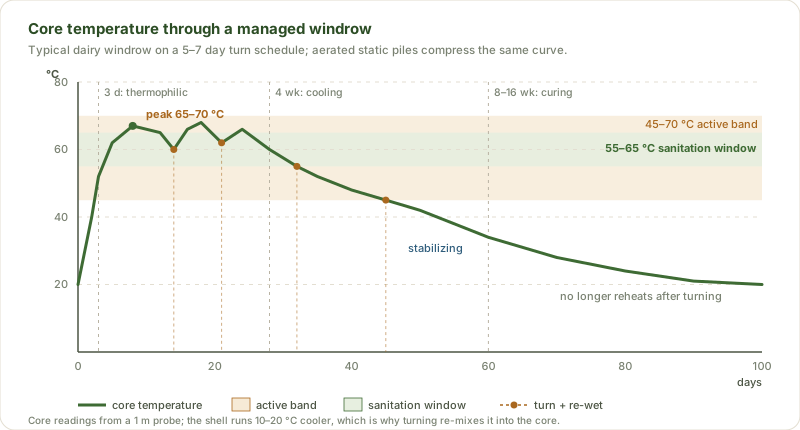
Chart: core temperature of a managed windrow over 100 days showing the thermophilic band, the 55–65 degree sanitation window, turning points, and the curing tail.
Temperature curveProcess Control and The Science
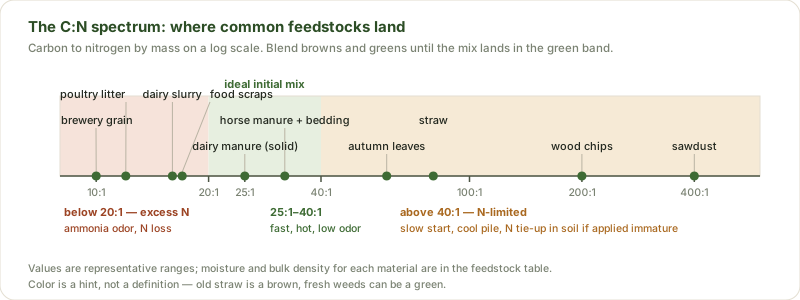
Diagram: logarithmic C to N axis with common feedstocks plotted and the ideal 25 to 1 through 40 to 1 mix band highlighted.
C:N spectrumFeedstocks & Recipes
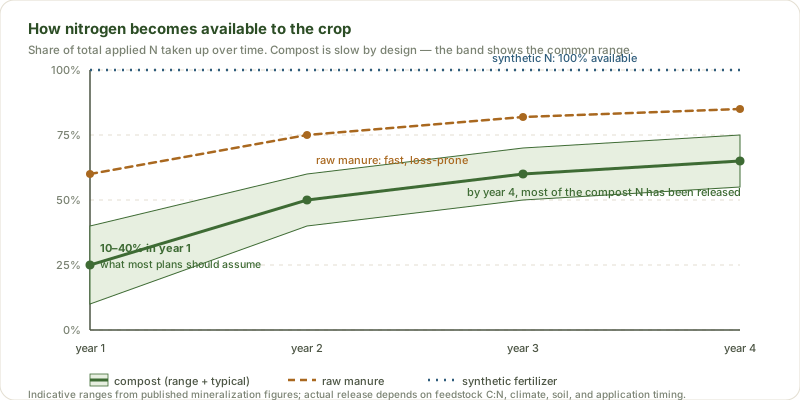
Chart: nitrogen release over four years for compost, raw manure, and synthetic nitrogen.
Nitrogen releaseSoil & Agronomic Benefits
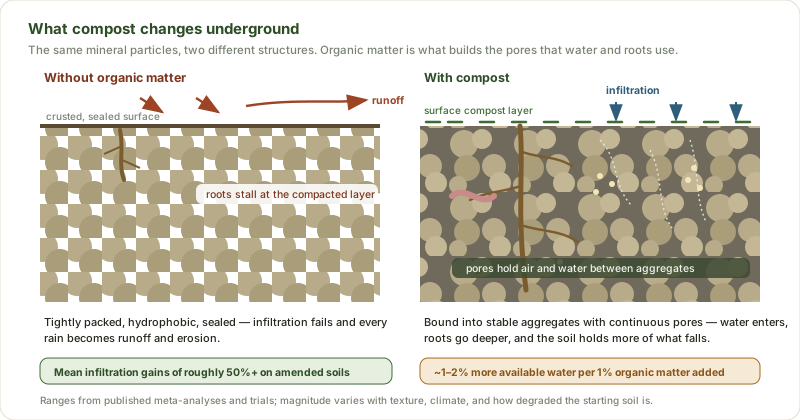
Illustration comparing compacted bare soil with compost-amended aggregated soil, including roots, pores, and water flow.
Soil structure, before and afterSoil & Agronomic Benefits
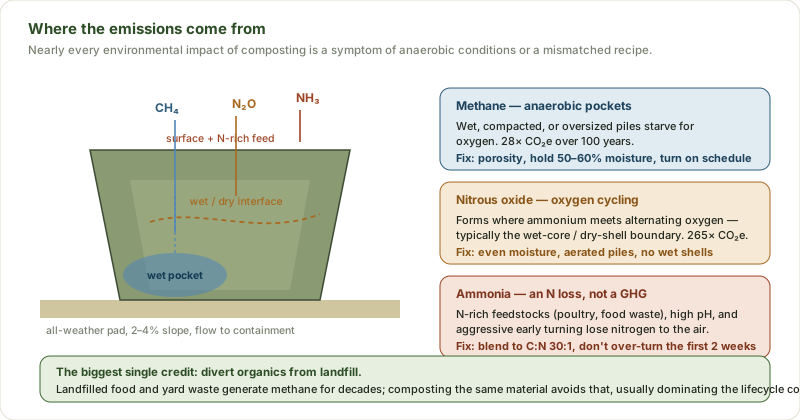
Diagram labelling the zones of a compost pile that produce methane, nitrous oxide, and ammonia, with the fix for each.
Where the emissions come fromEnvironmental Impact
Flow diagram of the pile water balance with inputs, outputs, pad slope, sump, and the reuse loop.
Pile water balanceWater & Leachate
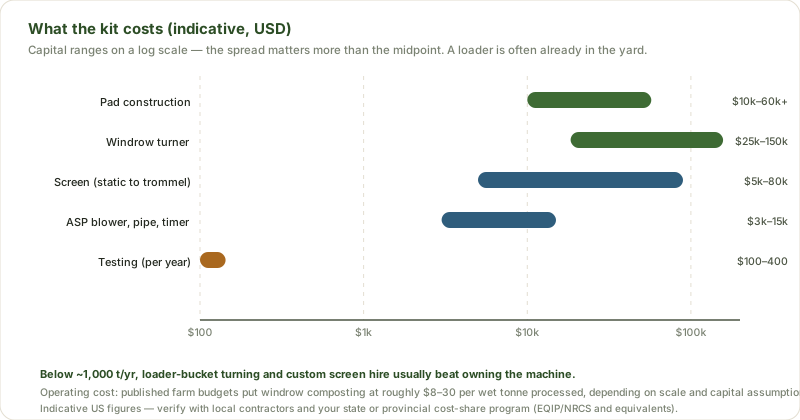
Chart of indicative capital cost ranges for farm composting equipment on a log dollar axis.
Cost rangesEconomics & Logistics
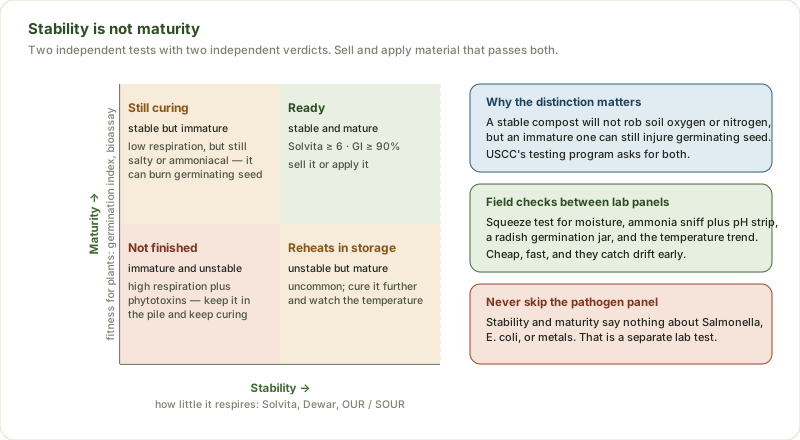
Matrix of compost stability against maturity with four practical verdicts.
Stability vs maturityQuality & Standards
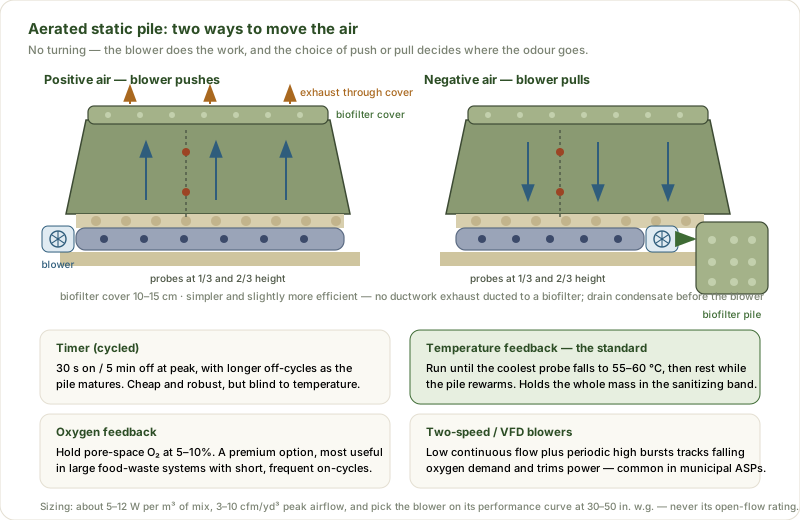
Diagram of an aerated static pile contrasting positive and negative air with the pipe plenum, biofilter, probes, and blower control strategies.
ASP aerationMethods & Systems
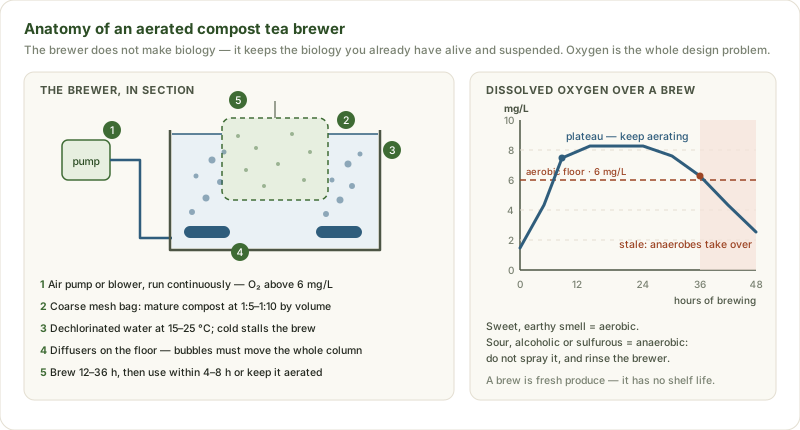
Section view of an aerated compost tea brewer with its air pump, compost bag and floor diffusers, beside a chart of dissolved oxygen through the brew.
Tea brewer anatomyCompost Tea
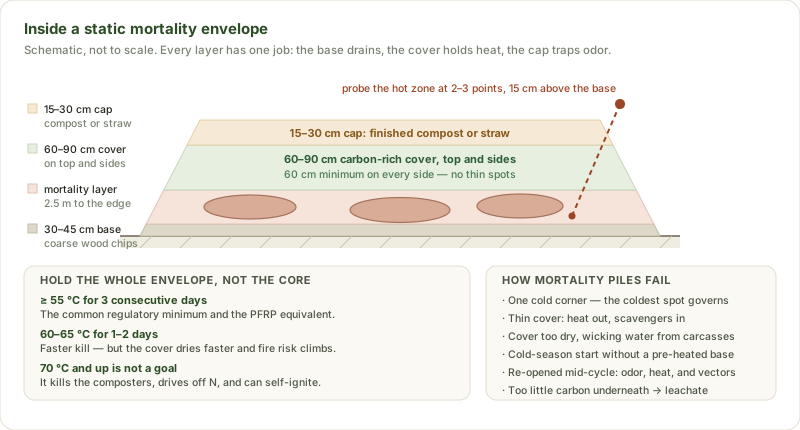
Cross-section of a static mortality composting envelope with its carbon base, mortality layer, cover, cap and probe, plus the hold times and failure modes.
Mortality envelopeMortality Composting
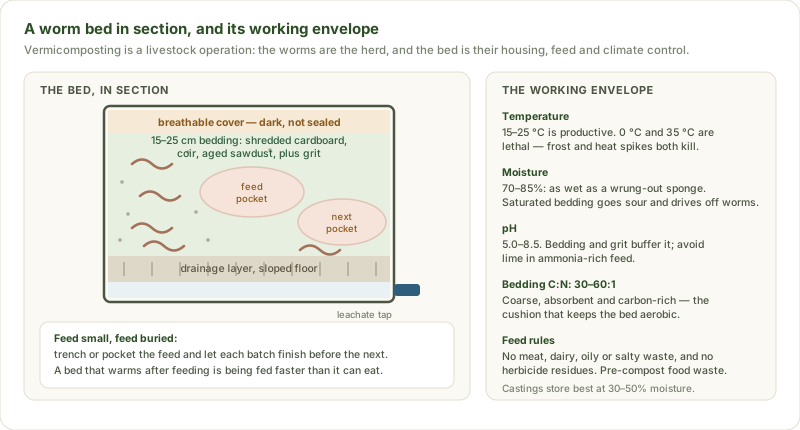
Cross-section of a worm bed with bedding, buried feed pockets, drainage and leachate tap, beside the working envelope of temperature, moisture, pH and bedding C to N.
Worm bed and envelopeVermicomposting
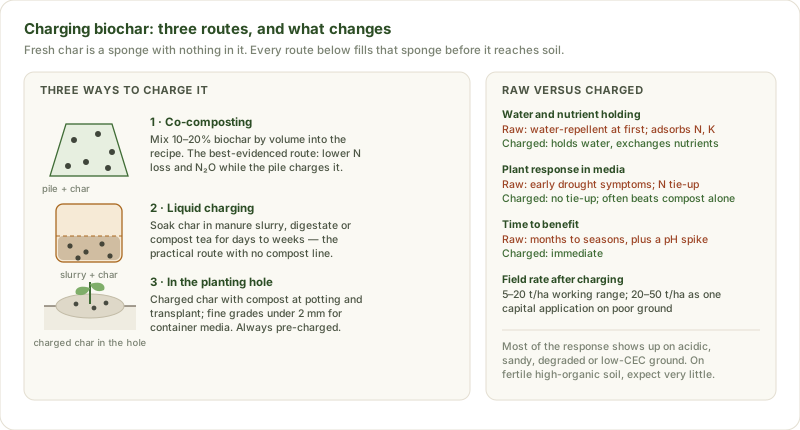
Illustration of co-composting, liquid charging and planting-hole charging, beside a raw versus charged comparison table.
Charging biocharBiochar & Compost
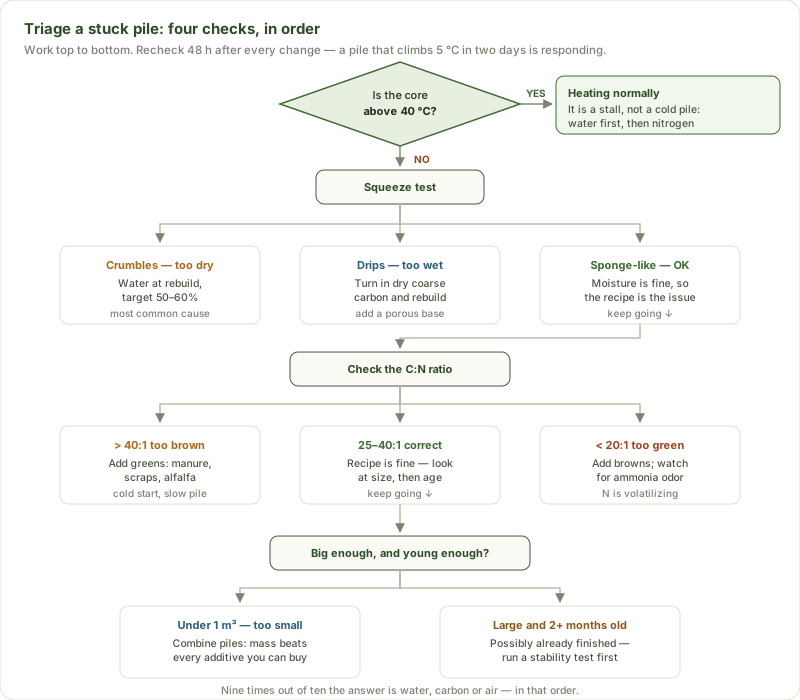
Decision flowchart for a stuck pile: temperature, squeeze test, C to N ratio, then pile size and age.
Stuck-pile decision treeTroubleshooting
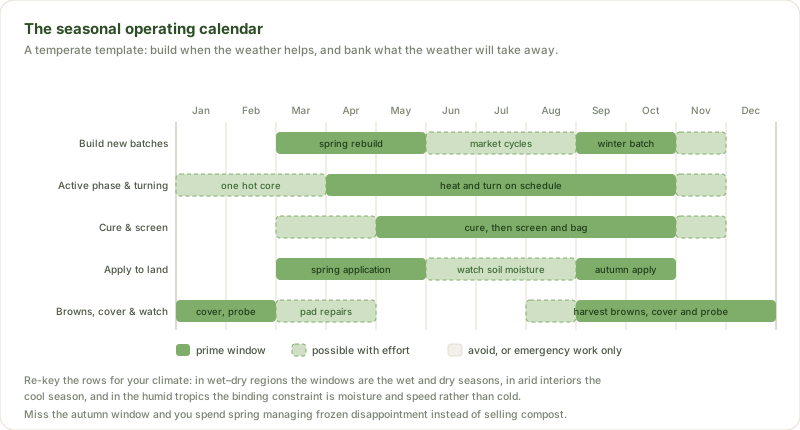
Twelve-month calendar of build, turn, cure, apply and cover windows for a temperate compost site.
Seasonal operating calendarClimate & Seasonal Operations
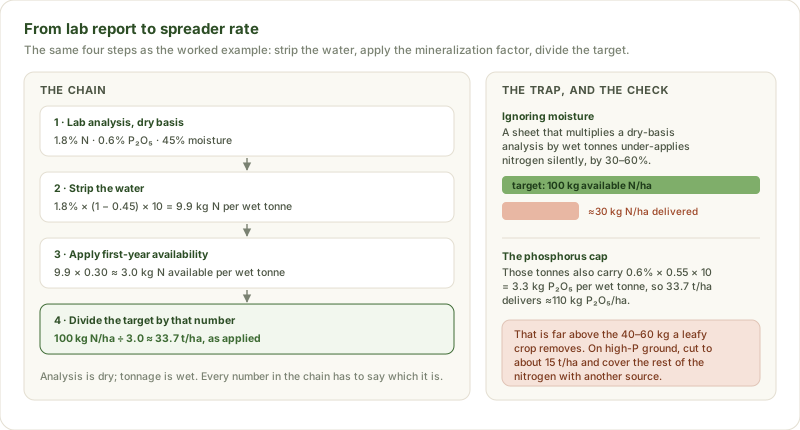
Worked chain from a dry-basis lab analysis to a wet-tonnage spreader rate, with the moisture conversion trap and the phosphorus cap.
Lab report to spreader rateField Application
Also worth printing: Reference Tables & Conversions collects every number from these chapters into tables.